Industry2vec An Implementation For Industry Code Vector Representation
TL;DR or Executive Summary
Industry code organizes companies into industrial groupings based on similar production or behavior. It is an important factor in banking and financial institutions data. However, since industry code is a kind of category code, it is not ideal for Machine Learning numerical computation. In this blog, we use a Siamese network architecture to generate a vector numerical representation of the industry code. This vector representations has a good interpretability and can be used in the numerical computation scenarios such as computing company similarities. We implement it in Keras and the open source repository is here.
Industry Code
Industry code (wikipedia) is a type of economic taxonomy that organizes companies into industrial groupings based on similar production processes, similar products, or similar behavior in financial markets.
There are several popular taxonomies, such as the North American Industry Classification System (NAICS), the Standard Industrial Classification (SIC) and the Standaard Bedrijfsindeling (SBI, a Dutch industry classification system). In ING Bank, the NAICS and SBI codes are used.
An industry code is usually defined in a hierarchical way. The NAICS code for example uses a five or six-digit code at the most detailed industry level. The first two digits designate the overall business sector, the third digit designates the subsector, the fourth digit the industry group and so on.
An example for the transportation industry is the following:
- 48: Transportation and Warehousing
- 484: Truck Transportation
- 4841: General Freight Trucking
- 48411: General Freight Trucking, Local
More information about the NAICS can be found at here.
The Need for Industry Code Embedding
We use the industry code as a feature in a number of machine learning models that we develop. The Peer Detection model for example searches in millions of companies for ones similar to the one given. Industry code is an important feature in the similarity calculation. Or the Holding Company Classificationmodel assigns an industry to a financial holding based on the company tree structure. A holding company usually does not produce goods or services itself, rather its purpose is to own shares of subsidiaries. An example is the holding company Air France-KLM, which owns airlines KLM and Air France. The classification model naturally uses the industry codes of the subsidiaries to classify Air France-KLM as an airline.
In machine learning we could use the industry code directly as a categorical feature. There are however some disadvantages. There are around two thousand industry codes. If we one-hot encode them, the feature space becomes quite large. In addition any relations among codes, like 4841 General Freight Trucking and 4842 Specialized Freight Trucking, will be lost. By embedding, i.e. representing the industries of companies as vectors, we can keep the feature dimensionality low and we may keep relations between industries.
Approach
We use a Siamese network architecture to generate a vector representation of the industry code. Siamese Networks are popular for the tasks of comparing homogeneous entities. There are some examples where two questions are compared to find if they are semantic duplicates of each other. Our approach is similar but in our case, the input entities are NAICS codes.
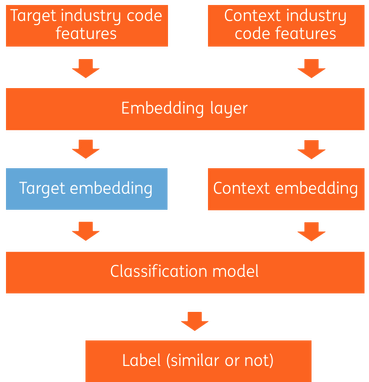
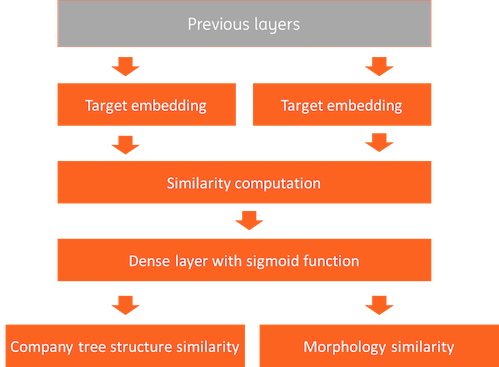
The siamese network architecture is shown in Figure 1. It contains an input layer, a feature layer, an embedding layer, a classification layer and an output layer.
- The input layers receive industry code pairs, one as target and another one as context. We will show how we generate industry code pairs in the next section.
- The feature layers convert industry codes to features. The industry code can itself be used as input, and a description of the industry such as “General Freight Trucking” for 4841 can be used as text input to the layer.
- The embedding layers build vector representations. We will elaborate on this later.
- The classification layer compares the vector pairs and predict them as similar or not as output.
Note that the blue block in Figure 1 is the industry code embedding that we are looking for.
NAICS Code Pair and Similarity Generation
The Siamese network of figure 1 has industry code pairs as input, one the target, the other the context. To train the network we need pairs labeled as similar and pairs labeled as dissimilar. Here we use two ways to compute similarity:
Company tree structure
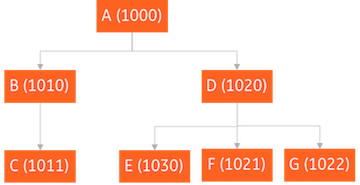
We have data on company trees. Figure 2 shows an example of a company tree with dummy names (capital letters) and dummy NAICS codes (4 digit numbers). We go under the assumption that the industries of a parent and its subsidiary are similar. Based on that assumption we extract similar industry code pairs from the company tree structures. The dummy tree of figure 2 for example would provide the industry code pairs (1000, 1010), (1000, 1020), (1010, 1011), (1020, 1030), (1020, 1021) and (1020, 1022). We also need to create dissimilar industry code pairs. Here we borrow the idea of negative sampling in word2vec. For any target industry code, we randomly sample an industry code and use the pair as a dissimilar industry code pair. In this way, we build 800K similar pairs and 800K dissimilar pairs.
Morphology similarity
While trying to predict if they are in the same tree, we also don’t want to completely fit to the tree data we have, because the number of digits they have in common is also important. Therefore, we create one more target to check if their first 2 digits are the same or not so that we regularize the model by making the NAICS codes in the same category more similar. By playing with the weights of the error function, we can decide how much regularization we want until we are satisfied with the result.
Embedding Layer
We use two ways of embedding with regard to NAICS code (categorical feature) and NAICS description (text feature), then we concatenate them as input to classification layer.
NAICS code embedding
For NAICS code, we employ an embedding layer. The embedding layer is basically a mapping table from a index to embedding vector.
NAICS description embedding
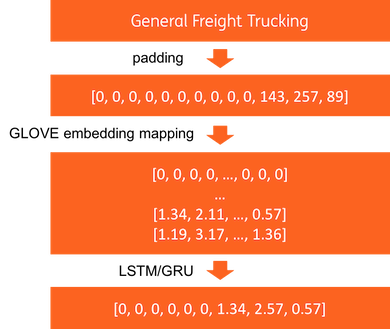
For NAICS text description, we use the pipeline as Figure 3 to learn the representation. First, the text descriptions with various length are padded as a fixed length indices. Then, the words (indices) are mapped as a GLOVE vector by using a Keras embedding layer with pretrained GLOVE weights (here we need to set trainable parameter as False). At last, an LSTM layer or GRU layer is used to represent the text sequence to a fixed length of representation.
Classification Layer
The classification layer compares the vector pairs of NAICS pairs from the previous embedding layers, and labels them as similar or not. First, cosine similarity is computed. Then, a dense layer with a sigmoid activation function is used for prediction. Logloss is used as loss function. As we mentioned in “NAICS code similarity generation” section, we have two types of similarities, company tree structure similarity (S_c) and morphology similarity (S_m). We use 0.8*S_c | 0.2 * S_m as weighted loss target. In this way, we can learn vector representations from company structure with supercategory similarity as regularizer.
Result
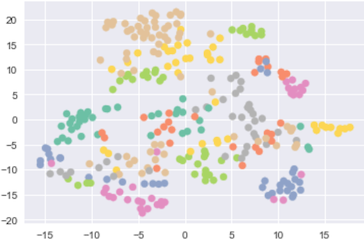
We implement the industry2vec model in Keras and open source the code here. The embedding vector can be visualized by t-SNE on a 2D space scatter plot as figure 5. We can see the industry code vectors scatter very well. We also provide a helper function get_most_similar to find the closest industry codes by euclidean distance based on our industry embedding vectors. Table 1 shows top 10 closest NAICS codes of Automobile Dealers (4411). Besides the NAICS codes in 44 categories (same first 2 digit), other vehicle related industries such as 4231, 8111 and 5321 are also found.
| NAICS | Distance | Description |
|---|---|---|
| 4411 | 0.000000 | Automobile Dealers |
| 4412 | 0.960577 | Other Motor Vehicle Dealers |
| 4231 | 1.692941 | Motor Vehicle and Motor Vehicle Parts and Supp… |
| 8111 | 1.698621 | Automotive Repair and Maintenance |
| 5321 | 1.857971 | Automotive Equipment Rental and Leasing |
| 4451 | 1.921574 | Grocery Stores |
| 5313 | 1.959386 | Activities Related to Real Estate |
| 5311 | 2.125843 | Lessors of Real Estate |
| 4471 | 2.142971 | Gasoline Stations |
| 5312 | 2.183306 | Offices of Real Estate Agents and Brokers |
Table 1: euclidean distance nearest neighbors of Automobile Dealers
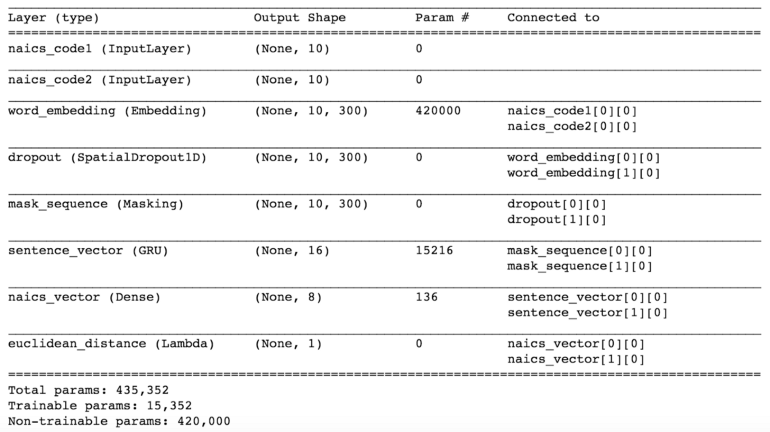
An Alternative Approach without Private Data
Alternatively, we can still train embeddings without using company trees. A siamese LSTM model can be used to predict the number of digits that two NAICS code description have in common. In order to do that, we can define our target as digit differences between two codes and try to minimize mean squared error. The training data is generated by using all possible NAICS code pairs. This time, we tried to approximate Euclidean distance, therefore we needed a layer to get square difference between the NAICS vectors. Here is the model summary.